mPerform Efficiency Dashboard
Dashboard showing machine efficiency in real time
Our team brings the expertise and strategic insight your business needs to grow in a competitive market. We build solutions that support sustainable growth and long-term success
Key benefits
- Shows efficiency as a percentage
- View daily and historical data
- Supports many kinds of machine
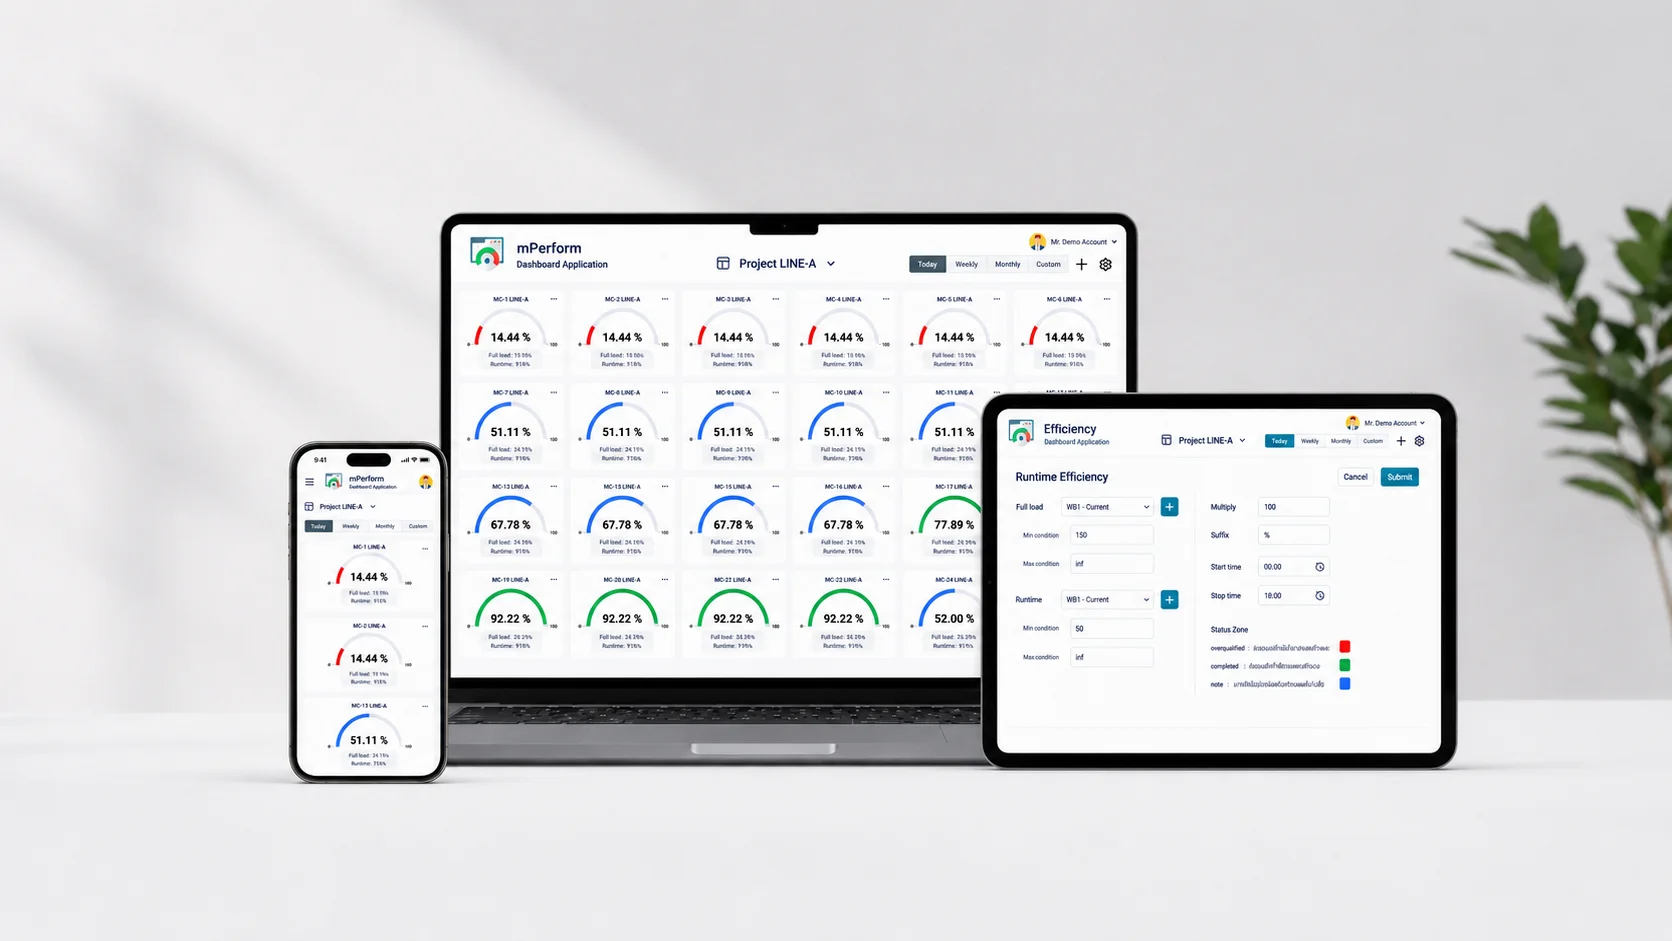
mPerform Efficiency
Dashboard showing machine efficiency in real time
Our team brings the expertise and strategic insight your business needs to grow in a competitive market. We build solutions that support sustainable growth and long-term success
Key benefits
- Shows efficiency as a percentage
- View daily and historical data
- Supports many kinds of machine
Common Factory Challenges
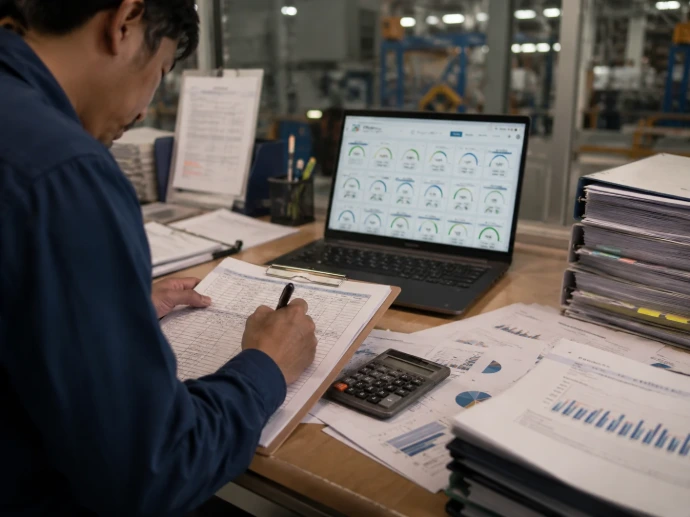
You know the machine is on, but not whether it is running at full efficiency
Many factories already have machine data, but still cannot clearly separate a machine that is switched on from one that is running at full efficiency, so analysing performance means calculating by hand, checking history is awkward and summarising reports takes a long time
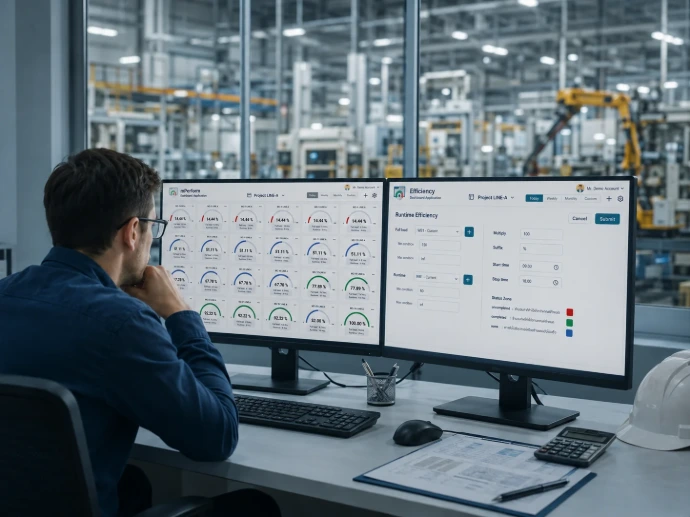
True efficiency is not visible
You see only machine status or energy readings, but not how fully the machine is performing
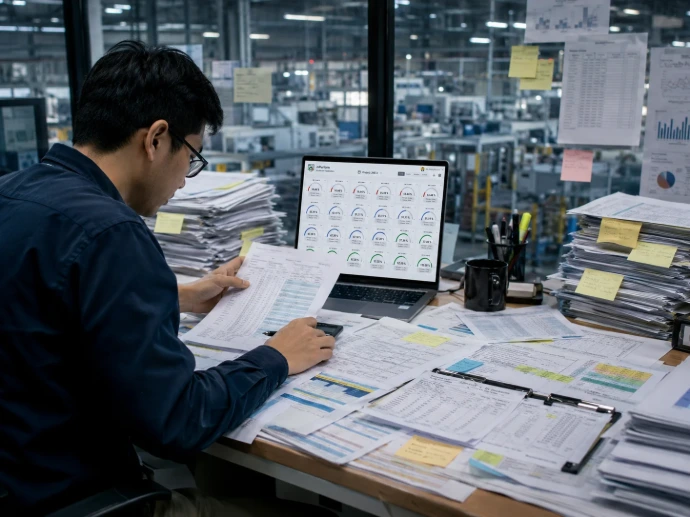
Runtime and full load are hard to separate
You do not know how many hours within the running period the machine was truly at full load
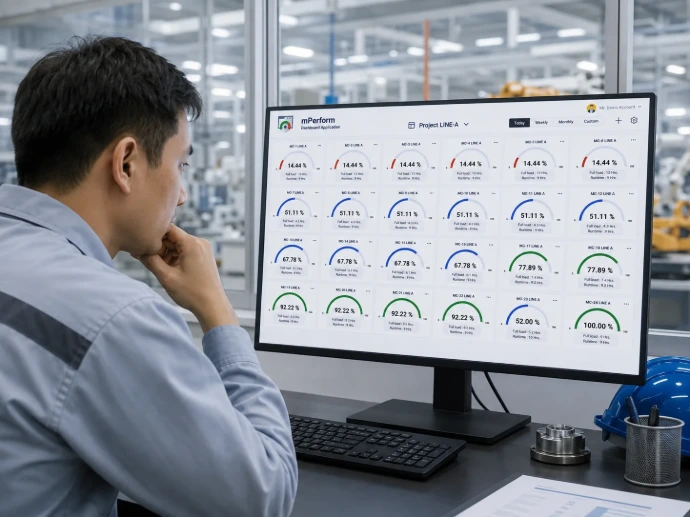
Checking history takes a long time
Data has to be pulled from several sources and combined by hand before efficiency can be analysed
Reports are still produced manually
Time is spent summarising daily, weekly or monthly data by hand
Factory Challenges
You know the machine runs, but not its real efficiency
Many factories already have machine data but cannot tell whether the machine is really working or merely switched on, so analysing efficiency and producing reports takes a long time
True efficiency is not visible
You see only machine status or energy readings, but not how fully the machine is performing
Runtime and full load are hard to separate
You do not know how many hours within the running period the machine was truly at full load
Checking history takes a long time
Data has to be pulled from several sources and combined by hand before efficiency can be analysed
Reports are still produced manually
Time is spent summarising daily, weekly or monthly data by hand
System Diagram
Connect machine data to the dashboard automatically
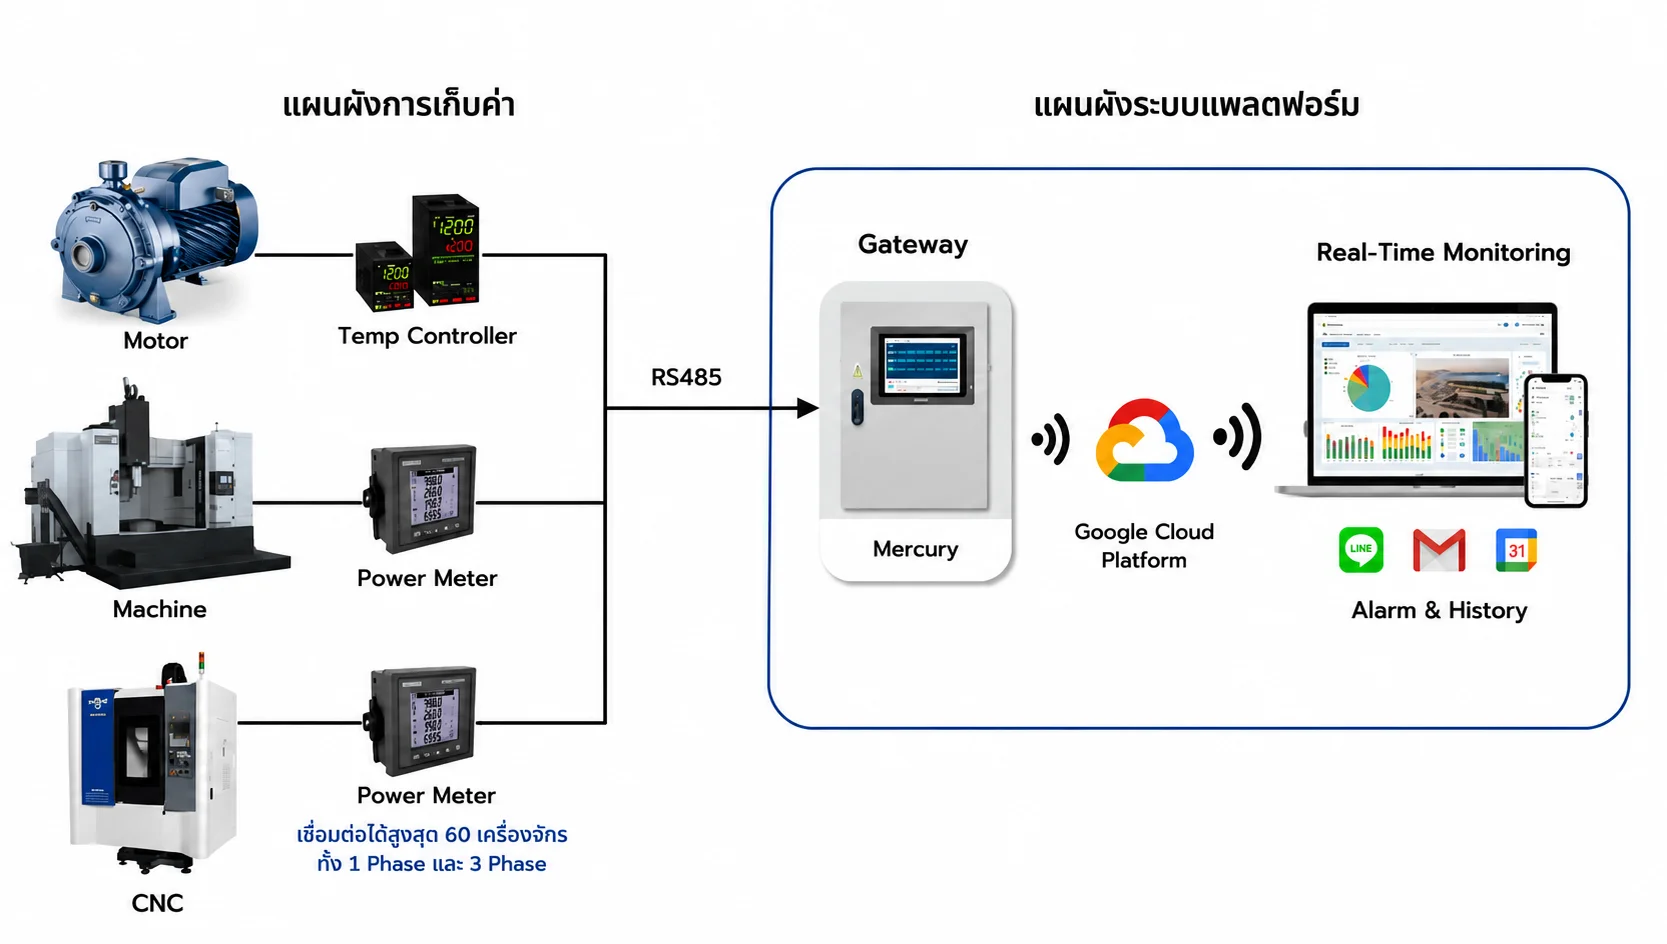
The system can connect data from in-plant equipment such as motors, machines, CNC, temperature controllers and power meters over RS485 to a Gateway or Mercury unit, and send it to the platform for real-time monitoring with alarms and history
System Diagram
Connect machine data to the dashboard
Connect data from motors, machines, CNC and other equipment through a gateway to the platform for real-time monitoring with alarms and history
Machine & Sensor Data
Receive data from machines, motors, CNC or power meters
Gateway / Mercury
Collect data from equipment through field connections
Dashboard & Report
Show efficiency, alarms, history and machine operating status on an easy-to-read dashboard, with CSV and PDF report downloads for checking history, analysing problems and planning production improvements straight away
Cloud / IoT Platform
Store and process machine data on a central platform to calculate runtime, full load and efficiency systematically, supporting history, many machines and many production lines for performance analysis
Efficiency Calculation Method
Calculate efficiency from runtime and full load
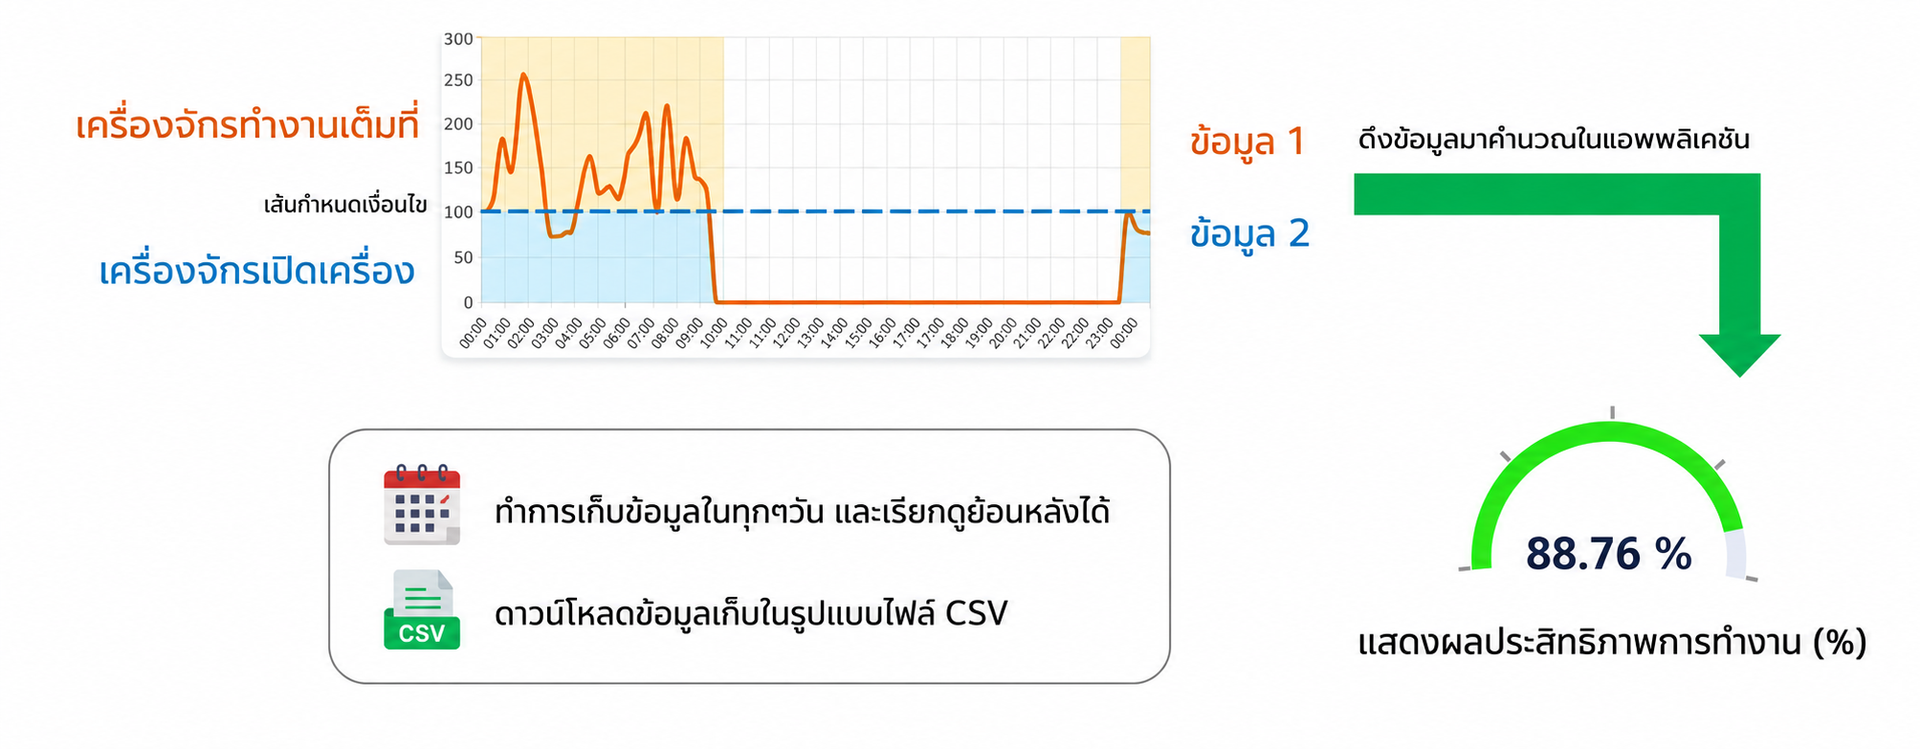
The system separates runtime and full load to calculate efficiency as a percentage and show it on a gauge dashboard
1
Runtime
The time the machine actually runs, used as the main measure of the operating period
2
Full Load
The time the machine meets the full-load condition, such as a defined energy value
3
Efficiency (%)
The efficiency figure, used to see how fully the machine is working
4
Efficiency formula
Efficiency (%) =
Full Load ÷ Runtime × 100
Efficiency Calculation
Calculate efficiency from runtime
Separate runtime and full load to calculate efficiency as a percentage and show it on a dashboard
1
Runtime
The time the machine actually runs, used as the main measure of the operating period
2
Full Load
The time the machine meets the full-load condition, such as a defined energy value
3
Efficiency (%)
The efficiency figure, used to see how fully the machine is working
4
Efficiency formula
Efficiency (%) =
Full Load ÷ Runtime × 100
Worked example
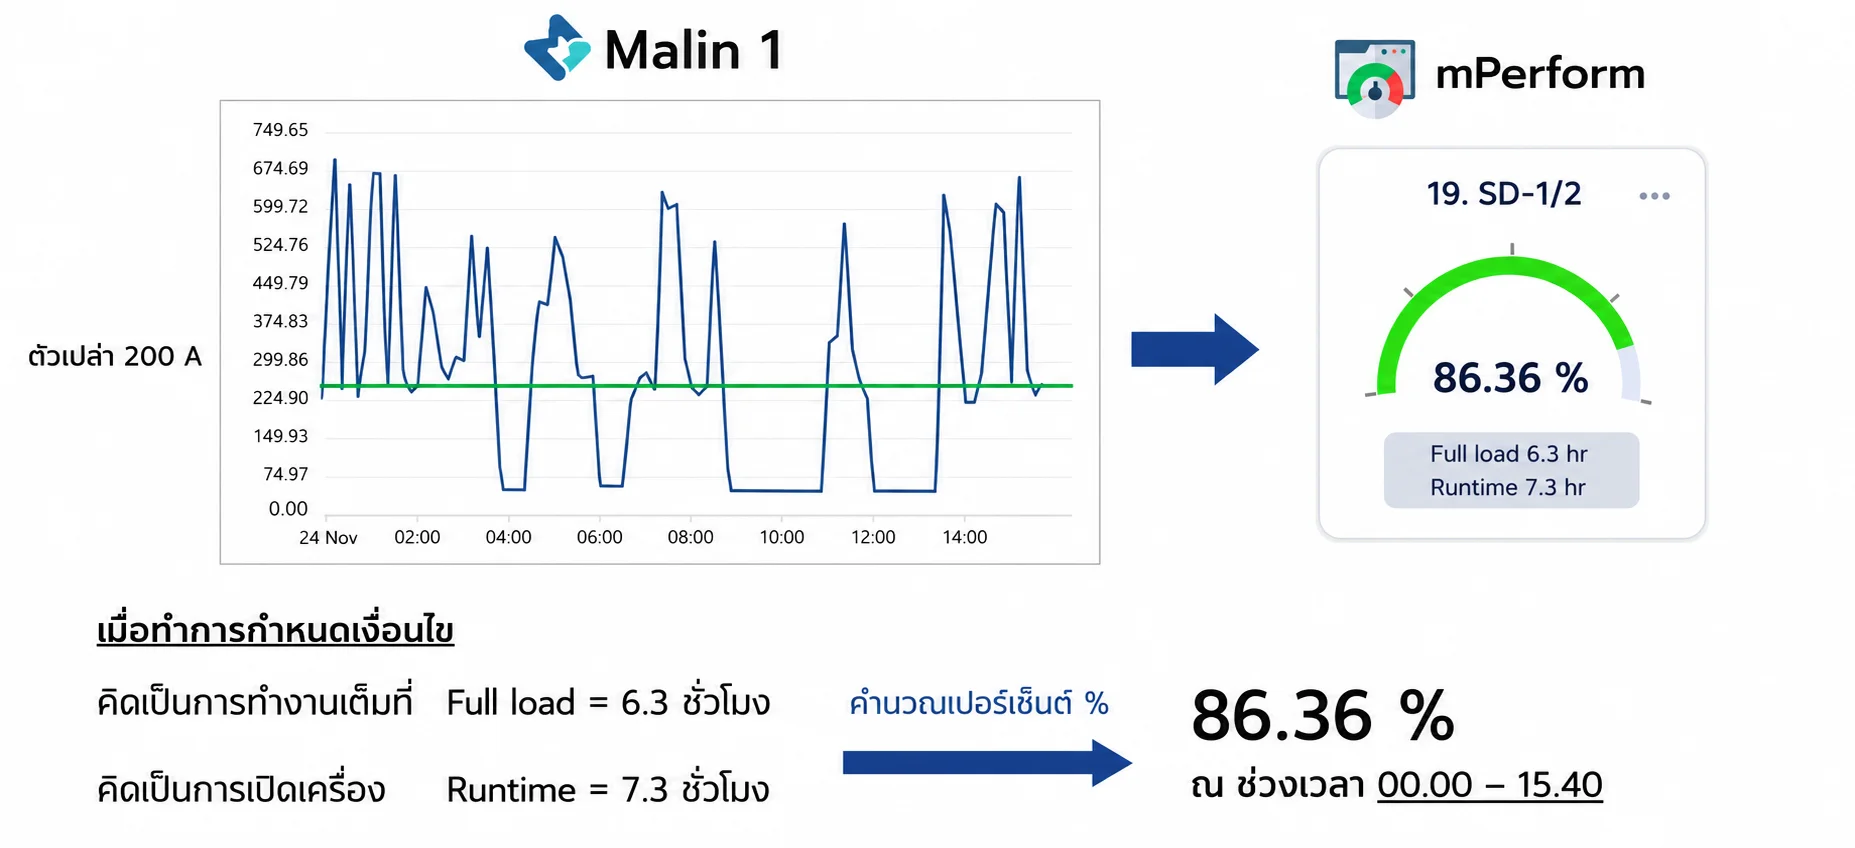
Example from the parameter Current Avg (Line A) between 00.00 and 15.40
Worked example
Example from the parameter:
Current Avg between 00.00 and 15.40
Dashboard Features
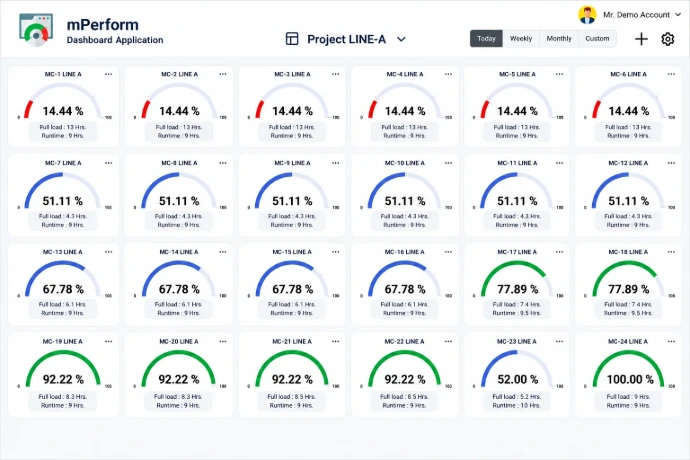
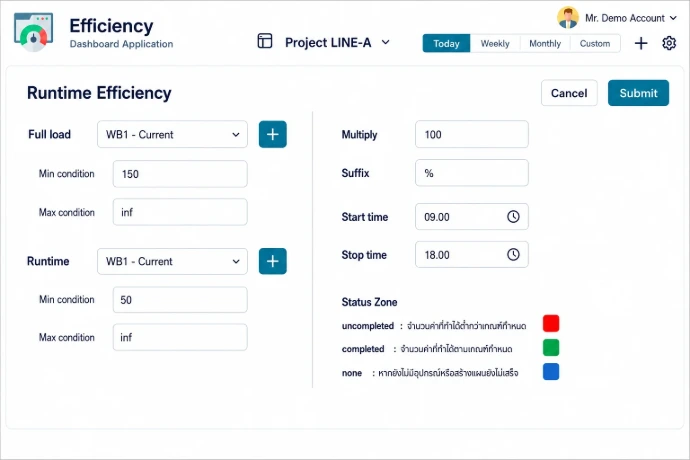
Dashboard for tracking machine efficiency at a glance
The dashboard lets plant supervisors see the efficiency of several machines on one page, shown as gauges with status colours, so they know immediately which machine is normal, which is below target and which is meeting its goal
Dashboard Features
Dashboard for tracking machine efficiency at a glance
Track the efficiency of several machines on a dashboard with real-time gauges
FAQ
FAQ
mPerform is a dashboard system that tracks and calculates machine operating efficiency, showing it as a percentage so the plant sees how each machine is performing more easily
The system measures the time a machine actually runs, its runtime, and the time it runs at full efficiency, its full load, then calculates efficiency as a percentage
The system compares full load against runtime to see what percentage of the running period the machine was truly at full efficiency
Data from machines, measuring devices or power meters is sent through a gateway into the cloud or IoT platform to be stored, processed and shown on the dashboard
It can show machine operating data on a dashboard, where users can see status, efficiency, runtime, full load and history for the period they select
FAQ
FAQ
mPerform is a dashboard system that tracks and calculates machine operating efficiency, showing it as a percentage so the plant sees how each machine is performing more easily
The system measures the time a machine actually runs, its runtime, and the time it runs at full efficiency, its full load, then calculates efficiency as a percentage
The system compares full load against runtime to see what percentage of the running period the machine was truly at full efficiency
Data from machines, measuring devices or power meters is sent through a gateway into the cloud or IoT platform to be stored, processed and shown on the dashboard
It can show machine operating data on a dashboard, where users can see status, efficiency, runtime, full load and history for the period they select
Start Smart with Digitechx
Start building the Industrial Intelligence system that fits your factory with the DigitechX team
Solution consulting Contact Us

Start Smart with Digitechx
Start building the Industrial Intelligence system that fits your factory with the DigitechX team
Solution consulting Contact Us