Online Service War Room
A real-time control centre for shop-floor data
Bring data from machines, sensors and equipment across several sites into one centre, so management and the service team see shop-floor status immediately, with alerts when something is abnormal, and can decide and act faster
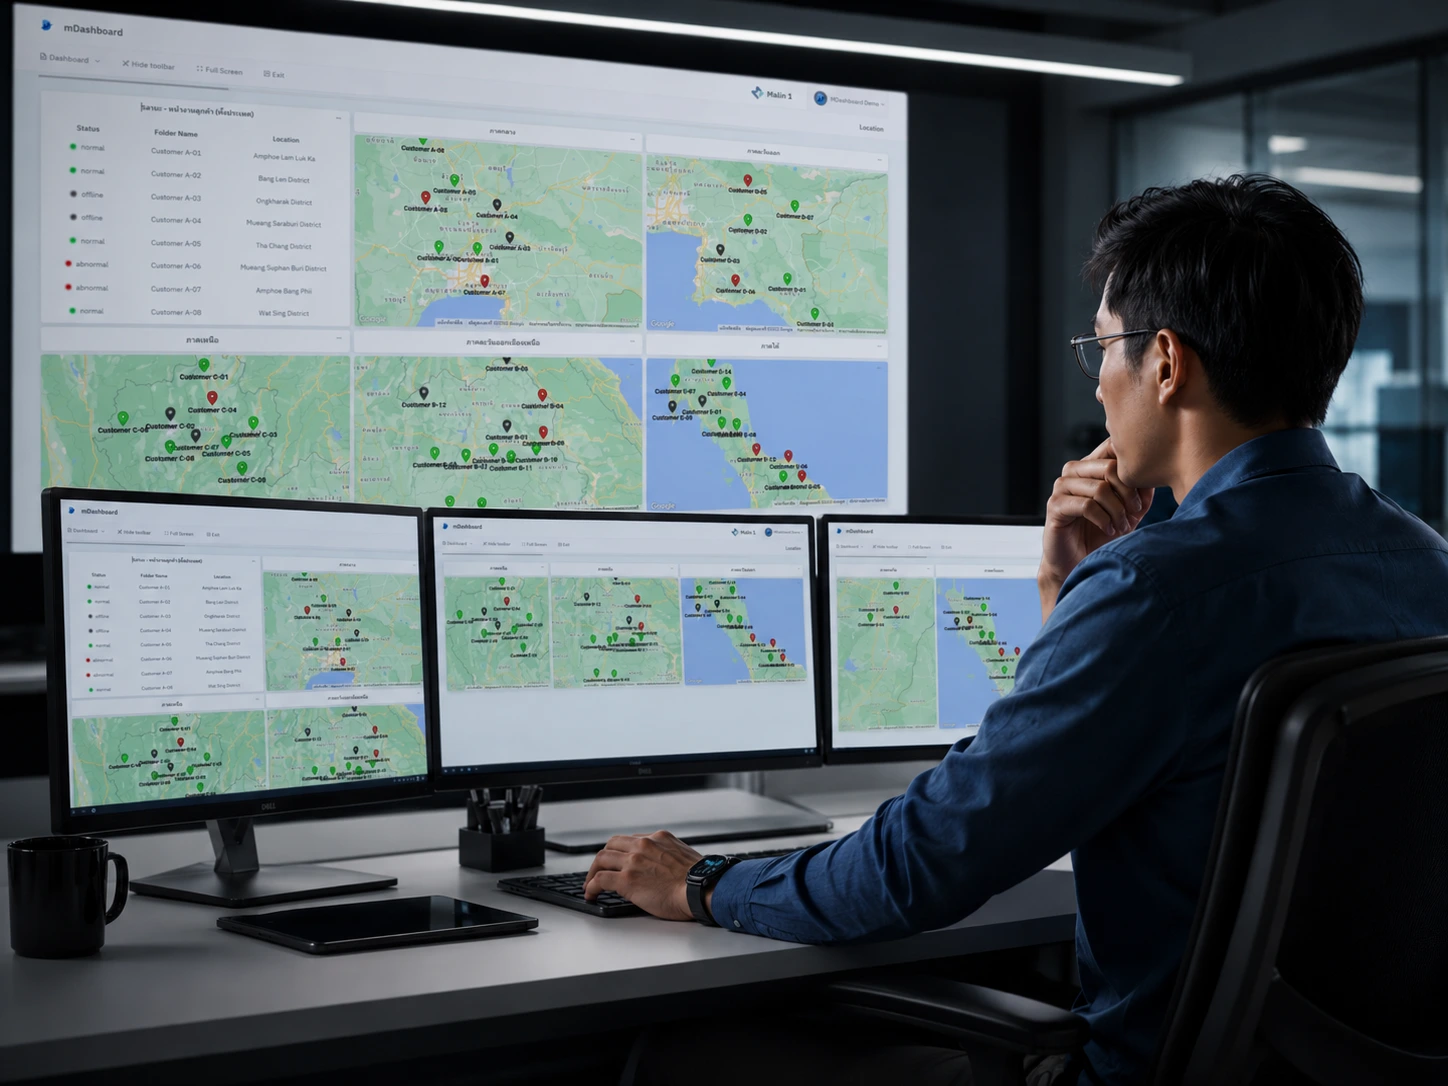
Service War Room
A real-time centre for shop-floor data
Bring machine and equipment data from several sites into one centre, tracking status and alerting on anomalies in real time
Why Digital War Room Matters
Why an organisation should have a central data centre
Many organisations have machines, equipment or branches spread across several sites, but the data is not gathered in one place, so checking status is slow, the shop-floor team has to report problems first, and management cannot see the whole operation at once
01
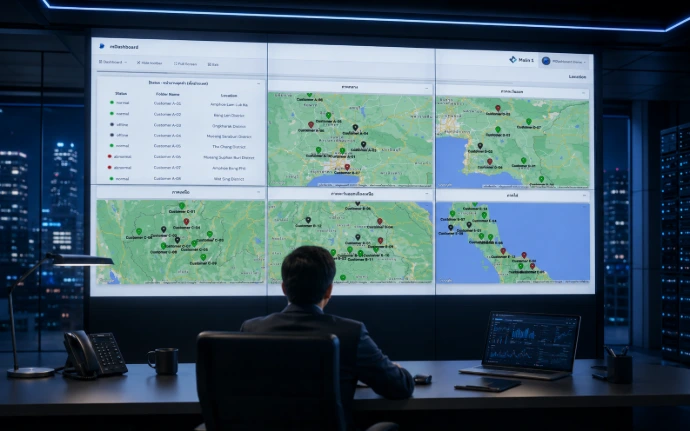
Data spread across many points makes equipment status at each site hard to check and slow to gather
02
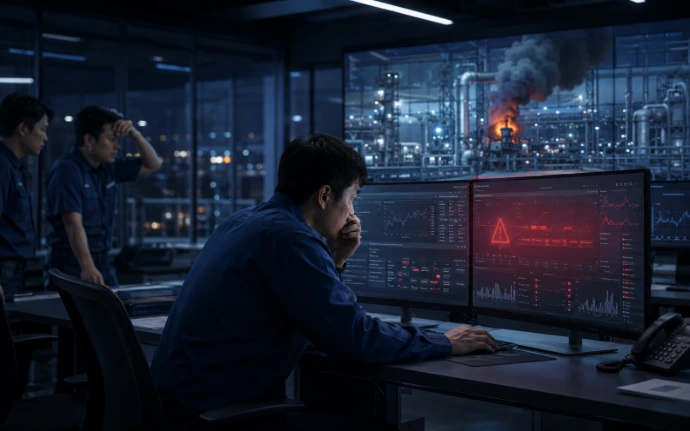
Slow response to problems. When something goes wrong the team may learn of it late, so the fix comes too late
03
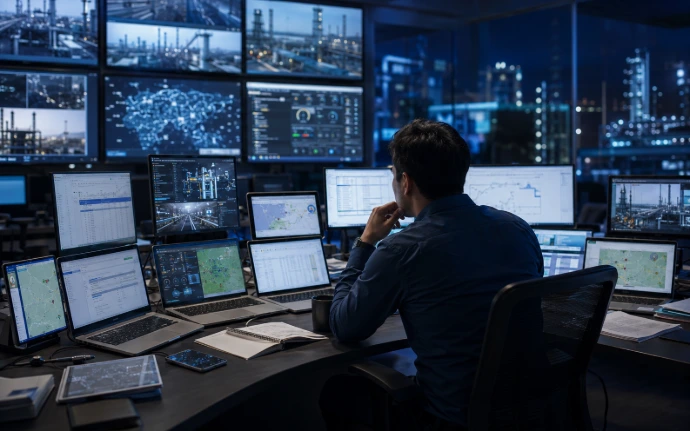
Management cannot see the whole picture. There is no central dashboard showing the operating status of the entire system
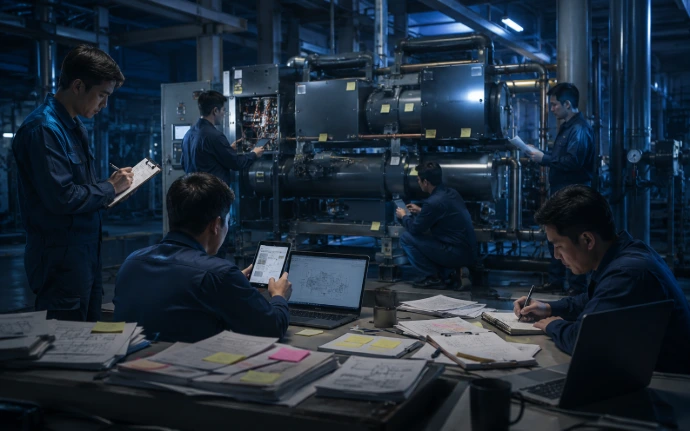
Duplicated service work Without a central system to track repair history, the service team repeats work or communicates incompletely
Why Digital War Room
Why an organisation should have a central data centre
Machines and branches across several sites keep their data apart, so status is slow to follow and management cannot see the whole picture in real time
01
Data spread across many points makes equipment status at each site hard to check and slow to gather
02
Slow response to problems. When something goes wrong the team may learn of it late, so the fix comes too late
03
Management cannot see the whole picture. There is no central dashboard showing the operating status of the entire system
Duplicated service work Without a central system to track repair history, the service team repeats work or communicates incompletely
System Overview
Connect shop-floor data to a central dashboard
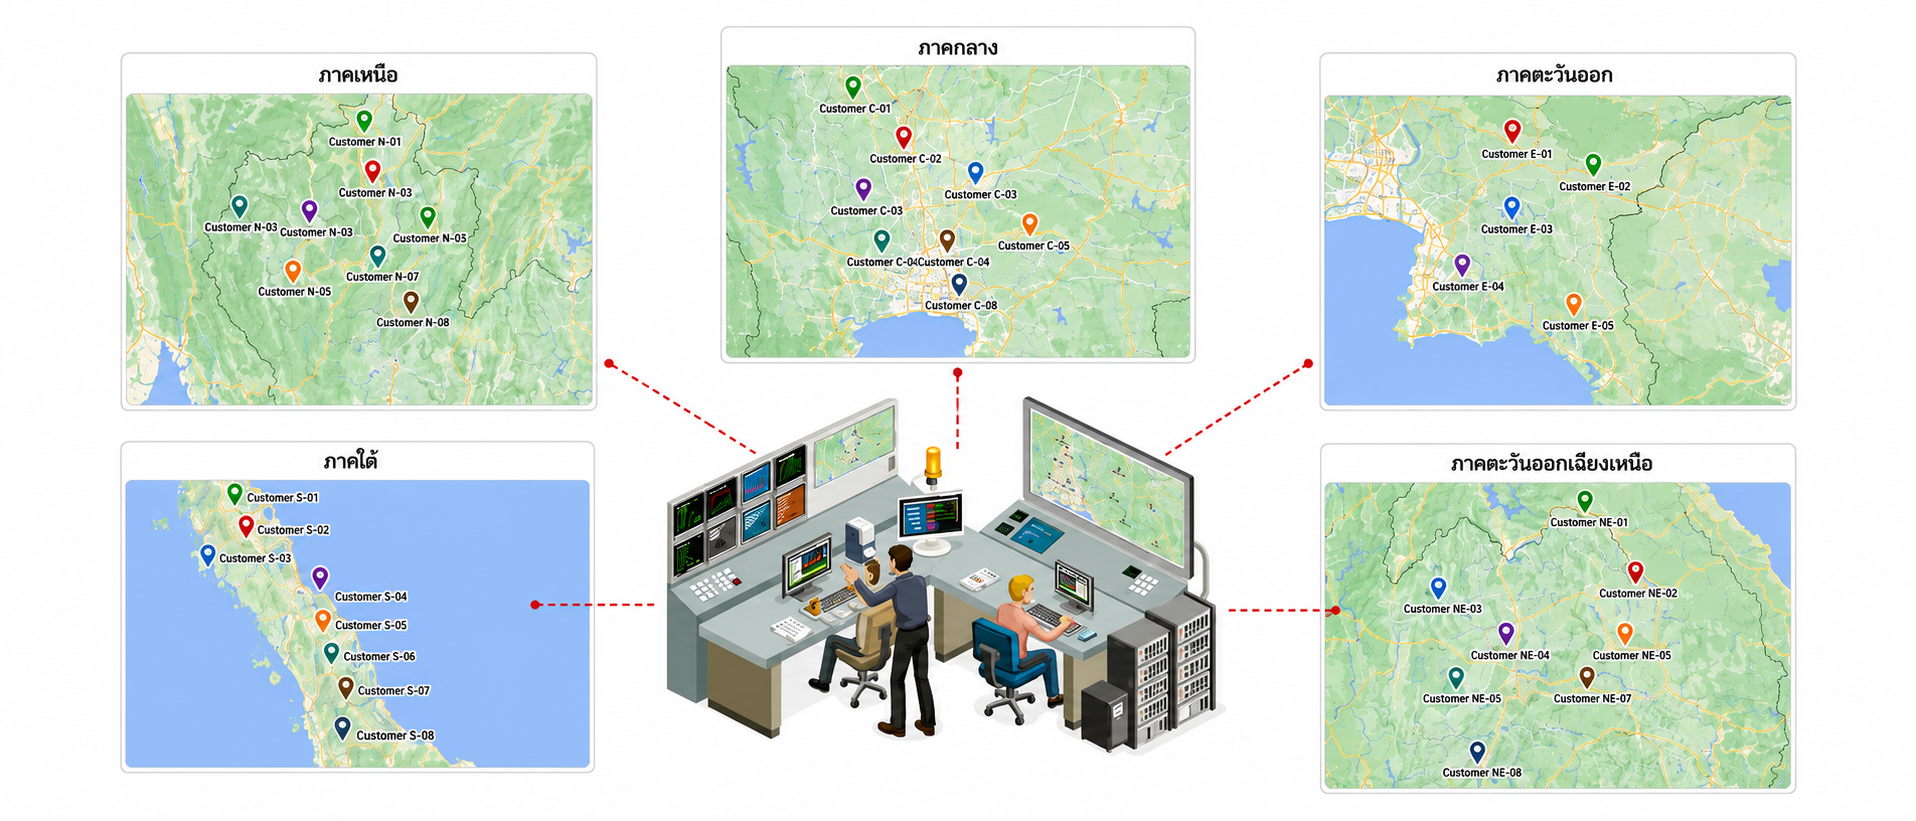
Connect data from equipment, sensors and machines to a cloud platform and show it on a central dashboard, so status can be tracked, data checked and alerts received remotely
System Overview
Connect shop-floor data to a dashboard
Connect data from equipment, sensors and machines to a cloud platform and show it on a central dashboard, so status can be tracked, data checked and alerts received remotely
Collect Data
Receive data from sensors, machines or shop-floor equipment, such as energy, temperature and status, and bring it into the system
Connect to Cloud
Send the data to a cloud platform to store, process and combine data from several sites in one centre
Alert & Action
Alert when a reading is abnormal or over the threshold, so the team can check and fix the problem faster
Real-time Dashboard
Show the data in real time on a dashboard, so users can follow status and readings immediately from a distance
Collect Data
Receive data from sensors, machines or shop-floor equipment, such as energy, temperature and status, and bring it into the system
Connect to Cloud
Send the data to a cloud platform to store, process and combine data from several sites in one centre
Alert & Action
Alert when a reading is abnormal or over the threshold, so the team can check and fix the problem faster
Real-time Dashboard
Show the data in real time on a dashboard, so users can follow status and readings immediately from a distance
Key Features
Key features of the system
The system is designed to help an organisation track equipment status, check data in real time and manage service work from one centre
Real-time Dashboard
Show equipment status, sensor readings and key data immediately, so users see the whole operation clearly and spot anomalies quickly
Central Monitoring
Bring data from several sites, branches or machines onto one screen, so the team does not have to check several systems separately and can follow everything from one centre
Alarm & Alerts
Alert automatically when a reading is abnormal or a status exceeds the threshold, so the team learns of problems early, checks with less delay and can plan the fix in time
Folder & Parameter Management
Group sites, equipment or parameters into categories, for example by branch, building, machine or data type, making them easier to find and maintain
Service History
Record the history of reported problems, inspections and maintenance for each piece of equipment, so the service team can review past work, avoid repeating it and analyse recurring problems better
Data Analysis
Use historical data to analyse how the system behaves over time, such as energy readings, equipment status or how often problems occur, to plan future improvements
Key Features
Key features of the system
The system is designed to help an organisation track equipment status, check data in real time and manage service work from one centre
Real-time Dashboard
Show equipment status, sensor readings and key data immediately, so users see the whole operation clearly and spot anomalies quickly
Central Monitoring
Bring data from several sites, branches or machines onto one screen, so the team does not have to check several systems separately and can follow everything from one centre
Alarm & Alerts
Alert automatically when a reading is abnormal or a status exceeds the threshold, so the team learns of problems early, checks with less delay and can plan the fix in time
Folder & Parameter Management
Group sites, equipment or parameters into categories, for example by branch, building, machine or data type, making them easier to find and maintain
Service History
Record the history of reported problems, inspections and maintenance for each piece of equipment, so the service team can review past work, avoid repeating it and analyse recurring problems better
Data Analysis
Use historical data to analyse how the system behaves over time, such as energy readings, equipment status or how often problems occur, to plan future improvements
Benefits for Users & Service Teams
The benefits you get from the system
The system helps both users and the service team work faster, with less travel, less duplicated work and more accuracy in tracking machine or equipment status
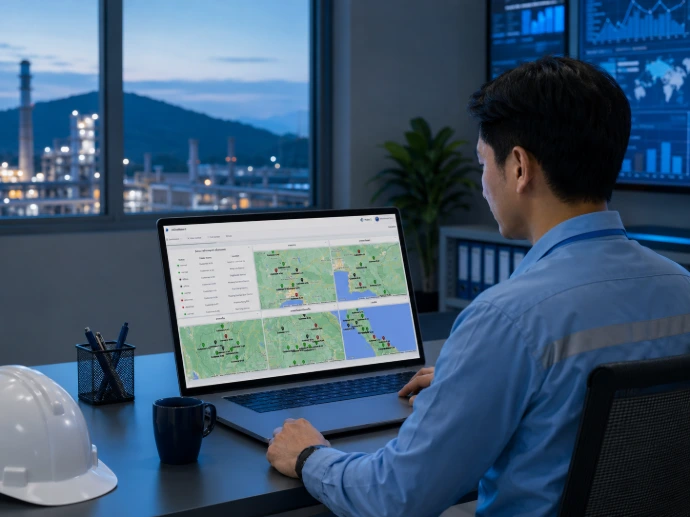
For customers and end users
- Check machine status remotely
- Spend less time inspecting on site
- See correct and accurate data
- Analyse operating trends
- Improve safety in use
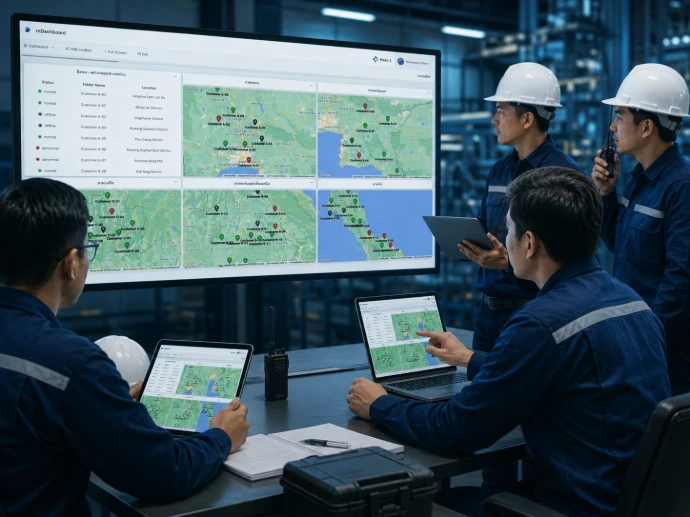
For the service team
- Receive problem alerts immediately
- Track service history systematically
- Reduce duplicated work within the team
- Plan service and maintenance better
- Build more trust in the service
Benefits for Users & Service Teams
The benefits you get from the system
The system helps both users and the service team work faster, with less travel, less duplicated work and more accuracy in tracking machine or equipment status
For customers and end users
- Check machine status remotely
- Spend less time inspecting on site
- See correct and accurate data
- Analyse operating trends
- Improve safety in use
For the service team
- Receive problem alerts immediately
- Track service history systematically
- Reduce duplicated work within the team
- Plan service and maintenance better
- Build more trust in the service
FAQ
FAQ
The Digital War Room is a centre for tracking data from machines, equipment or branches across several sites in real time, so management and the team see the whole picture on one dashboard
It reduces data spread across many points, slow status checks and duplicated service work, and helps the team respond to anomalies faster
Data can be viewed online or through the cloud from anywhere with an internet connection, which suits organisations with several branches or machines spread across many sites
When a measured value or equipment status is abnormal, the system can alert the team so they can check and fix it in time
It can show data from sensors or equipment such as energy, electricity, temperature, machine status, alarms and operating history
FAQ
FAQ
The Digital War Room is a centre for tracking data from machines, equipment or branches across several sites in real time, so management and the team see the whole picture on one dashboard
It reduces data spread across many points, slow status checks and duplicated service work, and helps the team respond to anomalies faster
Data can be viewed online or through the cloud from anywhere with an internet connection, which suits organisations with several branches or machines spread across many sites
When a measured value or equipment status is abnormal, the system can alert the team so they can check and fix it in time
It can show data from sensors or equipment such as energy, electricity, temperature, machine status, alarms and operating history
Start Smart with Digitechx
Start building the Industrial Intelligence system that fits your factory with the DigitechX team
Solution consulting Contact Us

Start Smart with Digitechx
Start building the Industrial Intelligence system that fits your factory with the DigitechX team
Solution consulting Contact Us