Your electricity bill is rising
but you still cannot see where it comes from
See abnormal consumption as it happens, trace it down to the line and the machine, then deal with the cause before it becomes next month's cost.
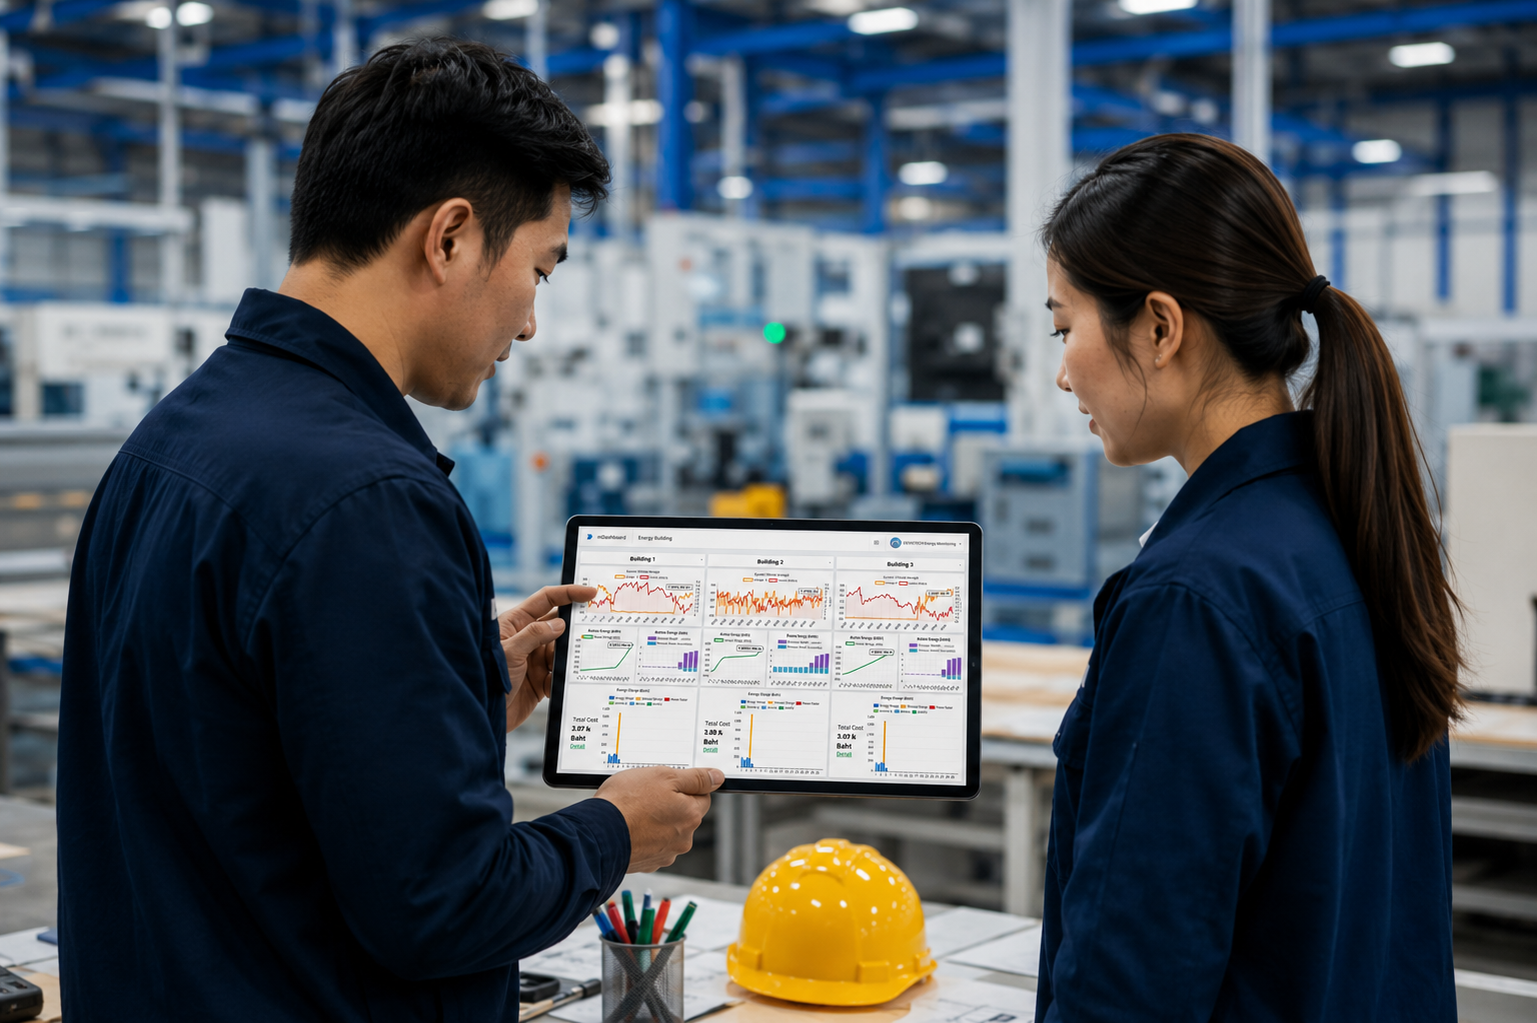
What your electricity bill is telling you, and you cannot see
Four questions a monthly bill cannot answer
Where is consumption above normal today
Seen line by line and machine by machine, not as one plant total.
Which machine draws more power without producing more
Consumption compared against output over the same period.
What causes your peak demand charge
Review the moment it occurred and the equipment running together then.
Did the change you made actually reduce anything
Measured after the change with the same data set used before it.
From an abnormal signal to the work that fixes it
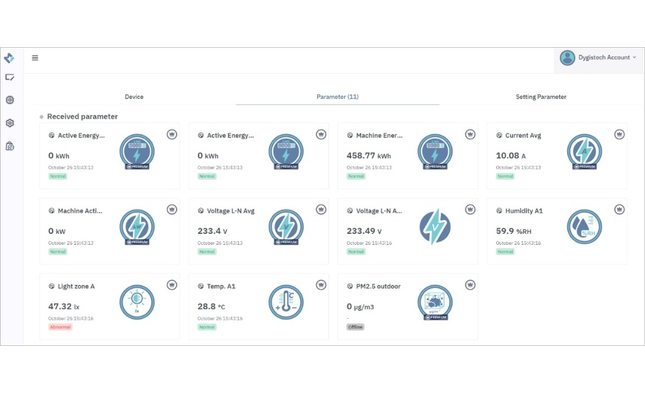
See the anomaly
The system points to readings outside the normal range, with the time they occurred.
Trace the cause
Work down from the plant overview to the line, the panel and the machine.
Act where it counts
Ordered by the size of the result, not by the order the findings appeared.
Verify after the change
Before and after compared over periods that can fairly be compared.
Connects to what you have, no need to start over
Add measuring points only where they are needed, and reuse the devices and meters already in the plant.
Plant floor data
Connectivity
Gateway
Collects device data over the wiring and network already in place, with no meter replacement.
Platform
DigitechX Platform
IoT Platform group
Usable answers
Our scope covers software, data integration and analysis. Field devices and meters belong to the plant, and existing ones can be reused.
More than a dashboard: from the plant floor to the decision
Connect field devices
Reads from the meters, controllers and machines already in use, across several standards.
Keep the history
Stored continuously so causes can be reviewed later, and measuring points added over time.
Analyse consumption
Traces the cause of abnormal usage instead of stopping at the monthly total.
Feed your business systems
Sends the data on to the systems your plant already uses to decide.
Our scope covers software, data integration and analysis. Field devices and meters belong to the plant, and existing ones can be reused.
If the bill is rising and the cause is still unclear, start from the data you have
Send an electricity bill, a photo of the meter, or details of the system you run today, and our engineers will help you assess where to start.