
Once a plant has finished installing a data collection system, the next question is usually not about data. It is about screens. Maintenance wants to see the values that are going wrong. Production wants the running total for this shift. Management wants the whole plant on one screen.
Build a single shared screen for everyone and the common result is a screen nobody really uses, because each team has to look past everyone else's data before reaching its own. This article explains how we deal with that, through an application called mDashboard, and states what still cannot be done.
What mDashboard is
mDashboard is a web dashboard application for displaying IoT data from the Malin1 platform. A dashboard here means a combined screen that shows values from several devices at once.
The important part is that users create and adjust the screens themselves, through a web browser, with no extra program to install and no need to call a developer. That difference matters more in practice than it first appears.
mDashboard is installed through Malin1's built-in application store, M1-Store, and sign-in uses the same account as Malin1 through an identity system called Keycloak, so users do not have to remember several passwords.
The platform underneath is described in the article on Malin1, the IoT platform for machine data
How a self-built dashboard differs from a fixed report
A fixed report is a screen the developer has already designed. It works immediately, but you cannot change it. Wanting something different means asking the developer and waiting for a release.
A self-built dashboard starts empty. The user chooses which values go on screen, where they sit, and how they are drawn. The deciding factor is therefore not how it looks. It is the question of who makes the change when the requirement changes.
In practice, what the floor needs always changes more often than the plan assumed. Letting users make their own changes usually costs less than designing a perfect screen up front.
Dashboard structure and display options
mDashboard organises things in four levels. Project is the largest unit, Dashboard is one screen, Widget is one display box, and Parameter is the value that box reads.
Nine widget types are available. The easiest way to understand them is not to memorise nine names, but to group them by the question each one answers.
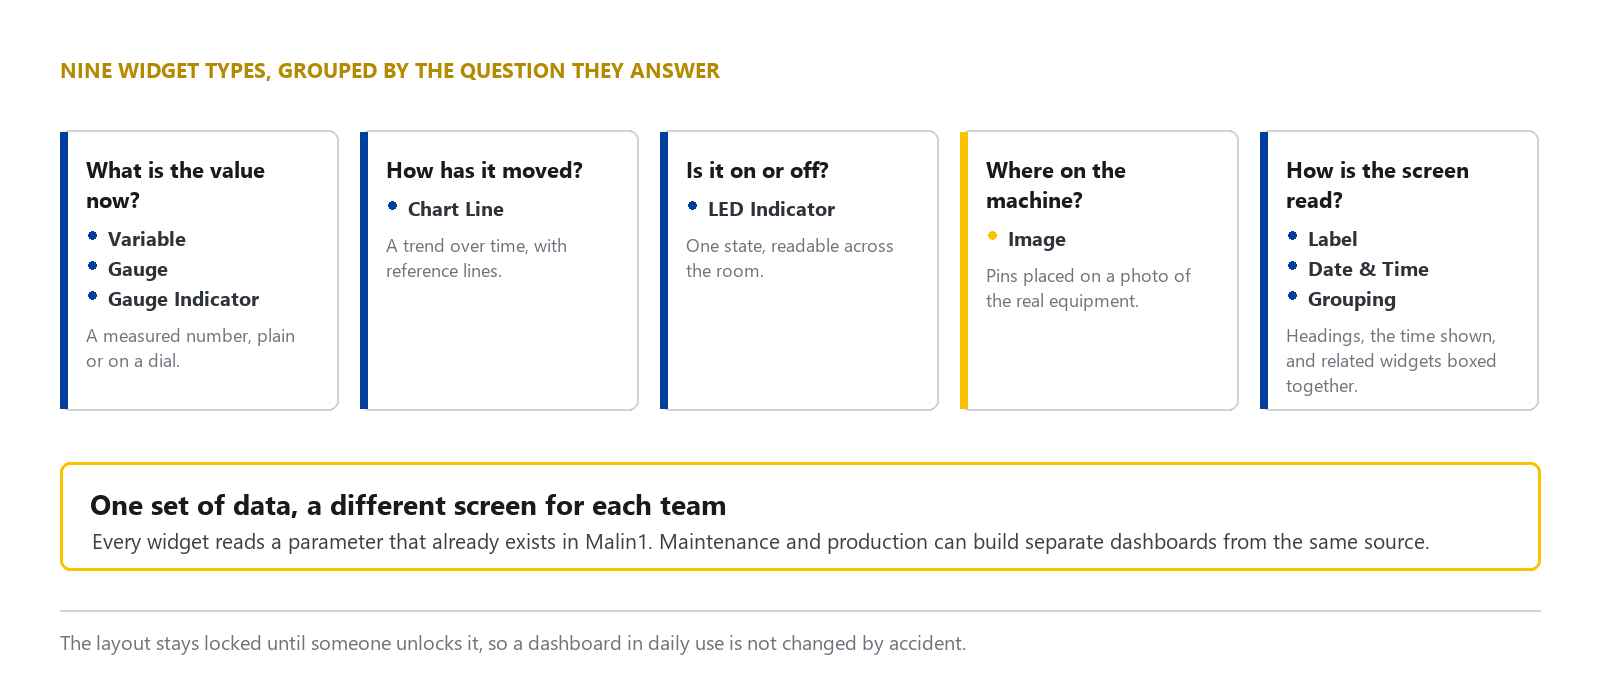
The Variable widget is the most used one, and it displays in five forms, from a plain value through to a minimum and maximum threshold, a progress bar, a cumulative total, and a conversion of the value into a range or a status. The same value can therefore tell different stories, depending on what the user needs.
The Chart Line widget answers what a current value cannot, which is whether the number in front of you is climbing or falling. Reference lines can be drawn to compare against a set threshold, and when more than one parameter is selected with different units, the widget shows a separate vertical axis for each.
Display readings on a machine image
The widget I find most interesting is the Image widget. The user uploads a photo of the actual machine or floor layout, then places pins at the positions where the values belong. Pins can be dragged to move, and the default view can be set by zooming or panning the image.
This matters because the recurring problem in a plant is not reading the numbers. It is that whoever is looking does not know where the sensor with that name is fitted on the machine. New staff have to ask an experienced colleague every time.
When the value appears on a photo of the real machine, that explanation is no longer needed.
Looking back, and taking the data out
A screen showing only current values answers only how things are right now. mDashboard therefore lets you choose a past date and time range to view, and export the data for every parameter on that dashboard as a CSV file.
A CSV file is a table file that opens in any common spreadsheet program. This part is necessary for analysis that has to happen outside the system, such as a monthly report that combines this data with figures from elsewhere.
Lock the screen layout
Widgets are arranged by dragging them freely, which is convenient while building but a risk in daily use, because an accidental drag on a touch screen can move a layout that was carefully arranged.
The system therefore separates a locked mode from an unlocked mode. A dashboard in daily use sits locked, and has to be unlocked before the layout can be changed. Background image, widget opacity, and title font size can also be set, so the screen stays readable from wherever the user actually stands.
System limitations
First, mDashboard can only show data that already exists in Malin1. If the value you want has not been brought in as a parameter there, there is nothing to put on the screen. Device connection work therefore always has to finish before screen work starts.
Second, users cannot write their own widget types. You choose from what the system provides. The set keeps growing as development continues, but at the time of writing the nine types above are the ones available.
Third, test on the real display device before going live, particularly floor-standing screens in the production area, which often run a different operating system and screen size from the machine used to design the dashboard.
Fourth, a good screen design does not happen in one pass. The first version usually carries more information than it needs, and improves once real users say which part they have never once looked at.
Getting started
A workable starting point is to choose one team first, ask what question they have to answer every day, and build a dashboard that answers only that. Once that team is genuinely using it, extend to the next one.
If you are unsure what each department needs on its screen, tell DigitechX which questions production staff, maintenance technicians or managers answer each day and what data is available. We can help arrange the dashboard around those needs.